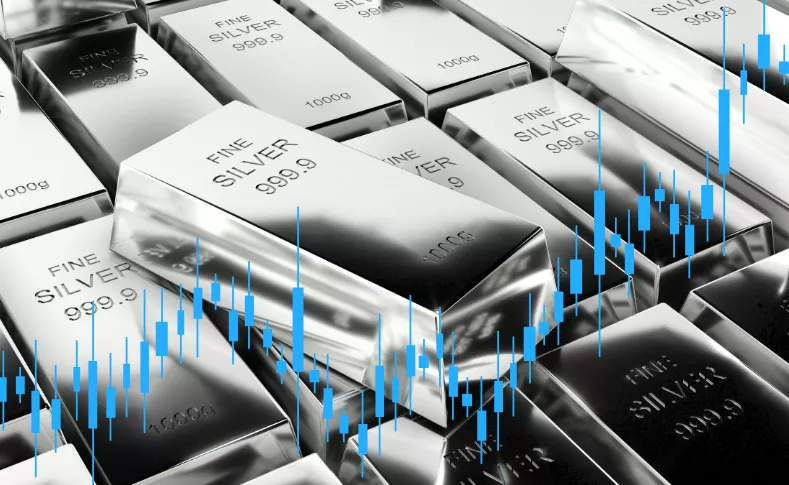
The single best window to trade silver runs from roughly 8:30 a.m. to noon Eastern time, when London’s afternoon session overlaps with the COMEX floor in New York and the day’s biggest US economic releases land at 8:30 a.m. sharp. That much silver shares with gold’s own best trading window. What silver does not share is a second, equally important clock: because well over half of global silver demand comes from solar panels, electronics, and industrial manufacturing rather than investment vaults, silver also reacts to purely industrial data, Chinese manufacturing figures, solar installation reports, EV production numbers, that barely move gold at all. Trading silver on gold’s calendar alone misses half the story.
The Trading Day Silver Actually Follows
Silver futures on COMEX, a division of the CME Group, trade on the Globex electronic platform nearly around the clock during the week: the session opens Sunday at 6:00 p.m. Eastern time and runs until Friday at 5:00 p.m., with a one-hour daily maintenance break from 5:00 to 6:00 p.m. That gives silver close to 23 hours of tradability on most days, a schedule closer to how the forex market stays open than to a conventional exchange with a single opening bell. Liquidity is not evenly spread across those 23 hours, though. Volume thins out overnight in North America and thickens again as Asian, then European, then American desks come online in sequence.
Investors accessing silver through equity-style instruments instead, such as the iShares Silver Trust ETF or shares of a silver mining company, are bound by a much narrower window: standard US stock exchange hours of 9:30 a.m. to 4:00 p.m. Eastern, Monday through Friday. That distinction matters more for silver than for most commodities, because premiums and discounts between spot silver, futures, and ETF shares can widen noticeably during the hours when futures markets are active but equity markets are closed, particularly during fast-moving news events.
The Noon London Fix: Silver’s One Daily Anchor
Amid all that near-continuous trading, one moment still functions as silver’s official reference price. The LBMA Silver Price is set once daily at 12:00 noon London time through an electronic auction administered by ICE Benchmark Administration, a benchmark refiners, miners, and industrial buyers use to value contracts and inventory. Gold’s equivalent benchmark runs twice a day, at 10:30 a.m. and 3:00 p.m. London time, but silver has only ever needed one fix, a difference that traces back to 1897, when the London silver benchmark was first established, 22 years before gold got its own equivalent fixing in 1919. The single daily fix means the minutes just before and after London noon routinely see a concentrated burst of institutional order flow as large participants square positions against that day’s benchmark.
The London-New York Overlap Is Still King
For retail and short-term traders, the highest-probability window remains the three-and-a-half hours when London’s afternoon session and New York’s morning session run simultaneously, roughly 1:30 p.m. to 5:00 p.m. London time, or 8:30 a.m. to noon Eastern. This window captures three things at once: the LBMA Silver Price fix at noon London time, the opening of COMEX floor-adjacent trading in New York, and the 8:30 a.m. Eastern release slot the US Bureau of Labor Statistics and Bureau of Economic Analysis use for headline data including the Consumer Price Index, monthly jobs reports, and GDP figures. The overlap is the same core mechanic behind why London-New York overlap hours drive the heaviest volume in currency markets, and silver, priced globally in dollars, rides the same tidal pattern.
Why Silver Swings Harder Than Gold at the Same Headline
Traders have nicknamed silver “the devil’s metal” for a reason that shows up directly in the data: the same piece of news routinely moves silver by a larger percentage than it moves gold. The mechanical explanation is market size. Silver’s total aboveground investable market is a fraction of gold’s, so the same dollar amount of buying or selling pressure produces a proportionally bigger price swing. Traders track this relationship through the gold-silver ratio, the number of ounces of silver it takes to buy one ounce of gold, which tends to compress when risk appetite and industrial optimism are both running high and widen sharply when investors retreat to gold alone as the more established safe haven. Historically the ratio has swung from a modern-era low near 15-to-1 in January 1980, at the peak of the Hunt brothers’ silver corner, to an all-time high above 120-to-1 in March 2020, when gold held up during the pandemic crash while silver, more exposed to industrial demand, briefly collapsed. Rather than settling into a stable range, the ratio has itself been unusually volatile through 2025 and into 2026, spiking above 100-to-1 in the spring, collapsing into the low 40s by January as silver spiked, and climbing back above 70 by mid-2026, a level of swing-within-the-swing that reflects just how unsettled the relationship between the two metals has become during silver’s own record run. A silver position, in practice, behaves like a leveraged bet on the same macro forces that move gold, without any actual leverage required, which is exactly why the same US inflation print or Federal Reserve statement that moves gold by half a percent can move silver by a full percent or more within the same few minutes.
The Second Clock Silver Watches That Gold Doesn’t
Industrial applications now account for roughly 59 to 61 percent of total global silver demand, up from about half a decade ago, driven overwhelmingly by solar photovoltaic manufacturing, electric vehicles, and electronics. Solar panels alone consumed close to 20 percent of all silver demand in 2024, nearly triple the share solar held just a decade earlier, because silver remains the best electrical conductor of any metal at room temperature and every silicon solar cell needs a silver paste to carry current to the panel’s circuit. That structural shift means silver-specific volatility clusters around release windows gold traders can safely ignore: Chinese manufacturing PMI data, solar installation and capacity figures out of China and the EU, and automotive production numbers tied to electric vehicle output, since a single battery-electric vehicle uses 25 to 50 grams of silver, roughly 70 percent more than a comparable gasoline car.
2025’s Record Run Rewrote the Old Session Patterns
Silver spent 2025 shattering every previous price record, including the peaks set during the 1980 Hunt brothers corner and the 2011 rally, touching an all-time high of $57.16 per ounce in late November, a roughly 90 percent gain year-on-year, after clearing the psychologically important $35 level earlier in the year for the first time since 2011. The rally coincided with a fourth, and by some counts fifth, consecutive year of structural supply deficit, since roughly 70 to 80 percent of mined silver comes as a byproduct of copper and zinc mining and doesn’t respond to silver’s own price signals the way a dedicated silver mine would. With freely available aboveground inventories thinner than they have been in years, the same size order that once moved the market a few cents can now move it considerably more, meaning the London-New York overlap window that used to define the day’s volatility increasingly gets compressed into even shorter bursts around the specific minute economic data crosses the wire.
That compression has practical consequences for execution. Bid-ask spreads on silver futures and CFDs, already wider in percentage terms than gold’s because of silver’s lower per-ounce price and thinner order book, tend to blow out further in the seconds surrounding a scheduled release during a deficit year, since market makers pull back liquidity precisely when the risk of a large, fast move is highest. The practical implication is straightforward: a market this thin rewards patience around the release itself, since the first violent tick often carries the worst available price of the entire move.
When Silver Broke the Rules: Two Squeezes, Different Endings
Silver’s history includes two attempts to break its own market structure entirely, four decades apart, with strikingly different mechanics behind them. In 1979 and early 1980, brothers Nelson Bunker Hunt, William Herbert Hunt, and Lamar Hunt used leveraged futures contracts to accumulate roughly a third of the world’s tradable silver, driving the price from about $6 an ounce to nearly $50. The scheme collapsed on March 27, 1980, later nicknamed Silver Thursday, when COMEX and the CBOT raised margin requirements and restricted trading to liquidation only, a rule change similar in spirit to the emergency trading halts covered in circuit breaker mechanics elsewhere in finance, forcing the Hunts to sell into a falling market and collapsing the price to $10.80 in a single session.
On February 1, 2021, in the same week the r/WallStreetBets community drove GameStop to historic highs, retail traders turned their attention to silver under the banner #SilverSqueeze, pushing futures up as much as 11 percent in a single session, the largest one-day move in over a decade, and briefly touching an eight-year high near $30. Unlike the Hunts, the 2021 buyers used cash rather than leverage and largely bought ETF shares and physical coins rather than futures contracts, but the market absorbed the pressure just as it had in 1980: CME Group raised COMEX margin requirements within days, and by the following weekend silver had given back most of its gains, retreating to the mid-$26 range.
| Event | Price Move | What Stopped It |
|---|---|---|
| Hunt Brothers corner, 1979-1980 | ~$6 to ~$50 an ounce | COMEX margin hikes, liquidation-only trading, Silver Thursday collapse |
| Reddit #SilverSqueeze, February 2021 | ~$27 to ~$30 an ounce | CME margin hikes, thinning retail conviction within a week |
Why Shanghai’s Clock Is Starting to Matter for Silver in a Way It Never Did for Gold
China’s role in silver is structural, not speculative: the country installed more solar capacity in the first half of 2025 alone than the rest of the world combined, and Chinese buyers dominate both the manufacturing side of silver demand and a growing share of physical trading through the Shanghai Gold Exchange and Shanghai Futures Exchange, which run two domestic sessions between 9:00 a.m. and 3:00 p.m. Beijing time, distinct from the Tokyo and Hong Kong windows covered by the broader Asian session. Because Shanghai’s contracts require actual physical delivery rather than COMEX’s largely cash-settled structure, some industry analysts estimate Shanghai silver has traded at a persistent 5 to 15 percent premium over COMEX and London prices through much of the past two years, a gap that would reflect genuine regional scarcity of physical metal rather than speculative positioning. For gold, a purely monetary asset, this premium barely registers as a trading signal. For silver, watching the Shanghai premium has become almost as relevant as watching the COMEX open, a distinction that didn’t meaningfully exist a decade ago and is a direct consequence of silver’s industrial demand outgrowing its investment demand.